Demography
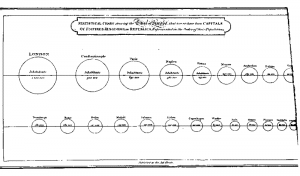
- The Statistical Breviary (1801)
- William Playfair The Statistical Breviary (1801) showing the relative population of cities by circles of different sizes, from London (first top left) to Edinburgh (last bottom right).
This is the first example of such visual display of quantitative data.
[click on the picture to enlarge it]
Population estimates (1)
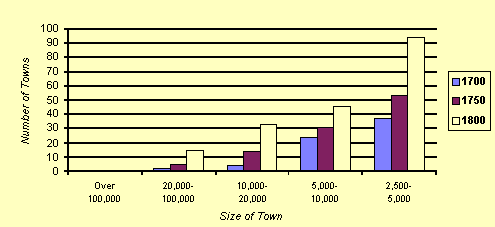
- Graph showing Number of towns between 1700 and 1800
- [click on the picture to enlarge it]
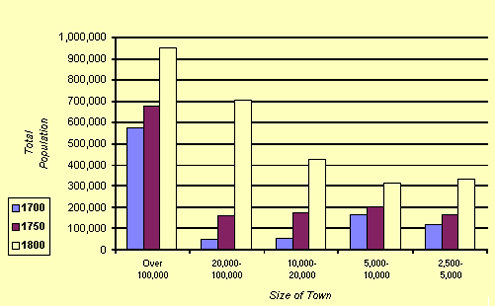
- Graph showing Total Population in towns between 1700 and 1800
- [click on the picture to enlarge it]
Urban Population Growth
Urban Population Growth, 1700-1800
- 1700:
| Size of Town | Number of Towns | Total Population |
|---|---|---|
| Over 100,000 | 1 | 575,000 |
| 20,000-100,000 | 2 | 52,000 |
| 10,000-20,000 | 4 | 55,000 |
| 5,000-10,000 | 24 | 168,000 |
| 2,500-5,000 | 37 | 120,000 |
| ----- | ---------- | |
| 68 | 970,000 |
- 1750:
| Size of Town | Number of Towns | Total Population |
|---|---|---|
| Over 100,000 | 1 | 675,000 |
| 20,000-100,000 | 5 | 161,000 |
| 10,000-20,000 | 14 | 175,000 |
| 5,000-10,000 | 31 | 201,900 |
| 2,500-5,000 | 53 | 167,500 |
| ----- | ---------- | |
| 104 | 1,380,900 |
- 1800:
| Size of Town | Number of Towns | Total Population |
|---|---|---|
| Over 100,000 | 1 | 948,000 |
| 20,000-100,000 | 15 | 702,473 |
| 10,000-20,000 | 33 | 428,040 |
| 5,000-10,000 | 45 | 313,759 |
| 2,500-5,000 | 94 | 332,859 |
| ----- | ---------- | |
| 188 | 2,725,171 |
Population Estimates (2)
Population estimates for each of the key cities in 1700, 1750, 1800
| 1700 | 1750 | 1800 | % increase, 1700 to 1800 | |
|---|---|---|---|---|
| Bath | n/a | n/a | 33,000 | — |
| Birmingham | 10,000 | 24,000 | 74,000 | 640% |
| Bristol | 21,000 | 50,000 | 60,000 | 186% |
| London | 575,000 | 675,000 | 959,000 | 67% |
| Norwich | 30,000 | 36,000 | 36,000 | 20% |
| Sheffield | n/a | 12,000 | 46,000 | 283% |
n/a: estimates not available
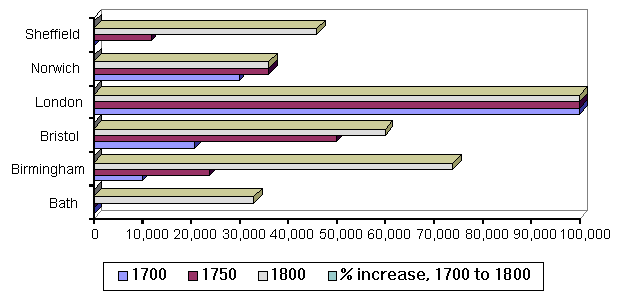
- Population estimates for each of the key cities
- [click on the picture to enlarge it]
Urban Inhabitants by Sex, 1801
| Men % | Women % | Total Inhabitants | |
|---|---|---|---|
| Bath | 39% | 61% | 32,200 |
| Birmingham | 47% | 53% | 60,822 |
| Bristol | 42% | 58% | 40,814 |
| London* | 46% | 54% | 721,181 |
| Norwich | 43% | 57% | 36,832 |
| Sheffield | 49% | 51% | 31,314 |
* Including the Cities of London and Westminster, and the following divisions of the County of Middlesex: Finsbury, Holborn and Tower.
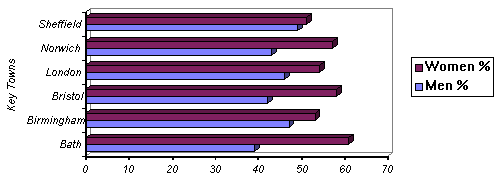
- Graph showing percentage of Urban Inhabitants by sex
- [click on the picture to enlarge it]

